
Quality Dimensions
Quality dimensions allow you to assess and categorize your data quality results across recognized criteria such as completeness, accuracy, and consistency. These dimensions help communicate which types of problems exist, not just where they exist.
They can be used for reporting, governance, and benchmarking — and are also exportable for integration with BI dashboards.
Where to find quality dimensions
Navigate to Settings > Quality Dimensions to view and configure them.
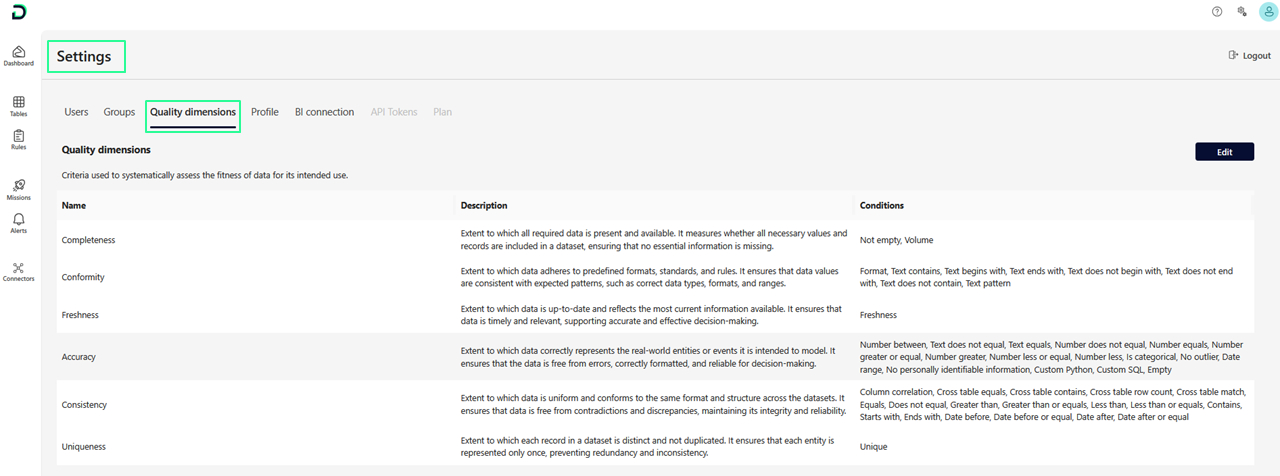 Each dimension includes a name, description, and rule mapping
Default dimensions
The DQC Platform includes the following predefined dimensions:
Completeness
Conformity
Freshness
Accuracy
Consistency
Uniqueness
Each dimension has a description and a set of rule types associated with it. This determines how rules contribute to quality scores in that dimension.
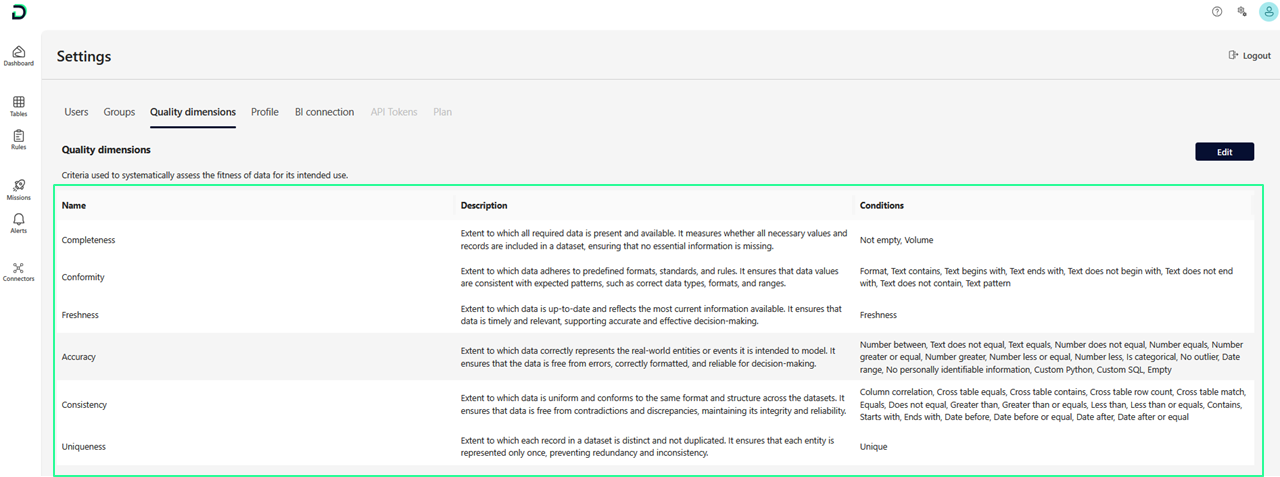 Click any dimension to see its linked rules and logic
Editing a quality dimension
To customize a dimension:
Go to Settings > Quality Dimensions
Click Edit next to a dimension
Update the:
Name
Description
Assigned rule types (which rule categories affect the score)
This allows you to tailor quality reporting to your organization's framework or industry requirements.
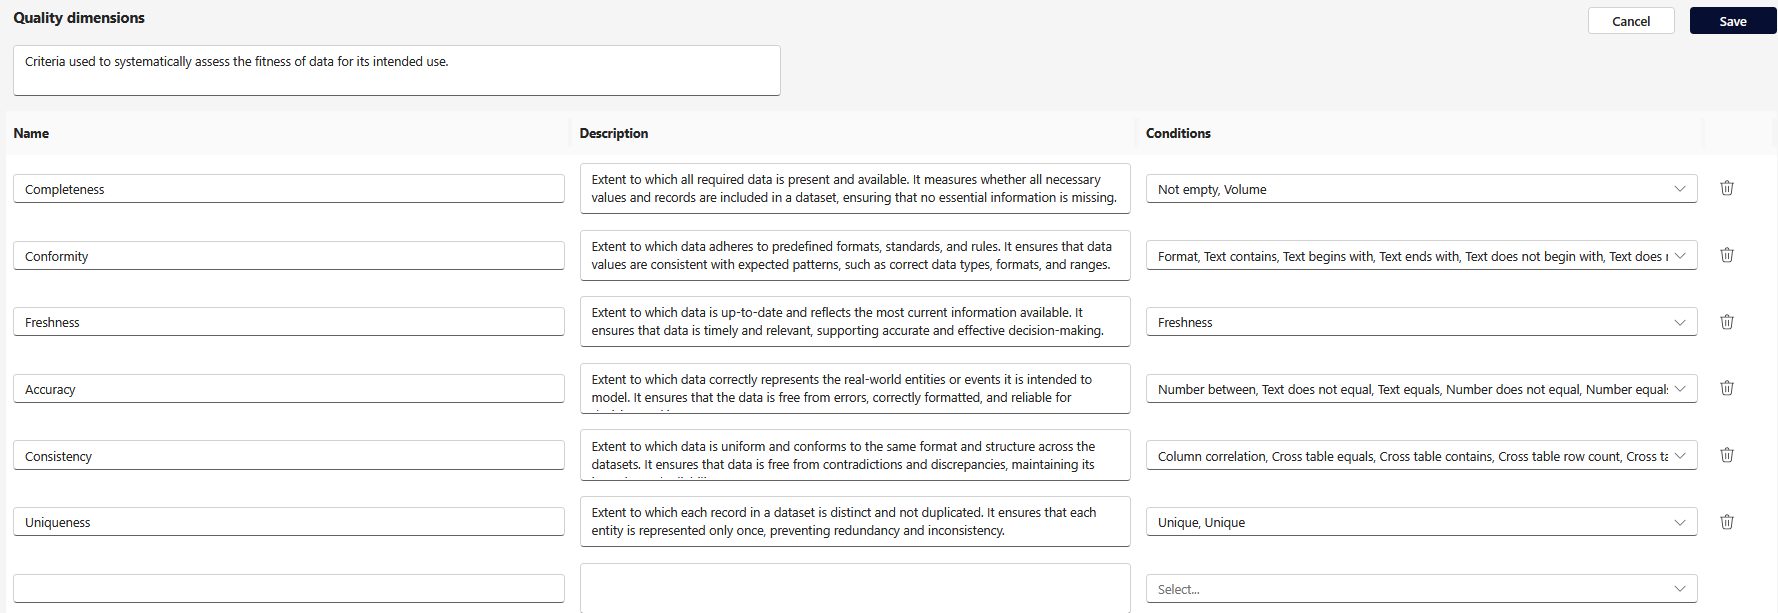 You can match rules to your own interpretation of each dimension
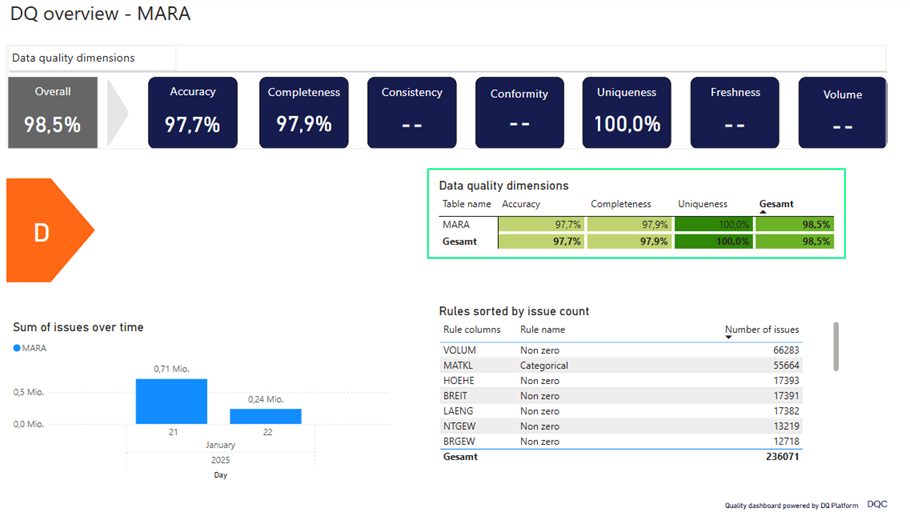
BI integration
Results by quality dimension can be visualized in a Power BI dashboard.
Use this view to:
See which tables underperform in specific dimensions (e.g. low completeness)
Track progress over time across departments
Support governance, audits, and stakeholder communication
 Notes
Notes
Custom dimensions can be added via Settings
Learn more: Working with Tags, Overview of existing rules, BI Integration