
Profiling tab
The Profiling tab is automatically generated for every connected table in the DQC Platform. It provides an at-a-glance view of column-level statistics and correlations — helping you identify patterns, spot issues, and define meaningful data quality rules.
What the profiling tab shows
For each column, the tab displays summary statistics:
Null values
Uniqueness
Minimum
Maximum
Average
PII
This gives you a clear first impression of the data’s shape and health — and helps identify potential rule candidates like "Not empty", "No outlier", or "Categorical".
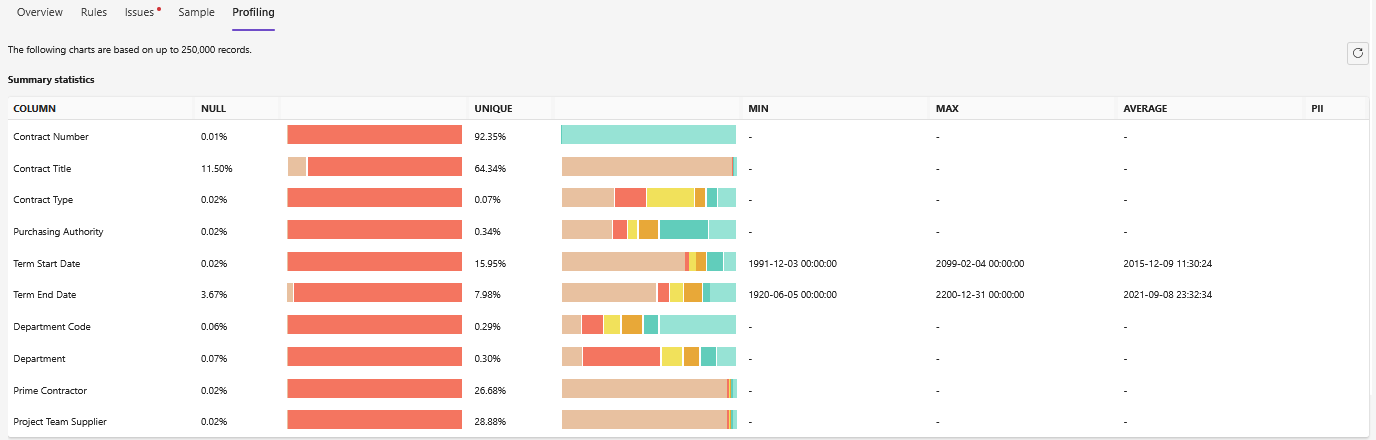 Key stats like NULL count and value ranges appear per column
Correlation matrix
Below the statistics table, you'll find a correlation matrix showing the relationship between columns:
 Yellow = positive correlation
 Blue = negative correlation
This is particularly useful when identifying potential multi-column rules, such as "Start Date should be before End Date" or "Awarded Amount = Consumed + Remaining".
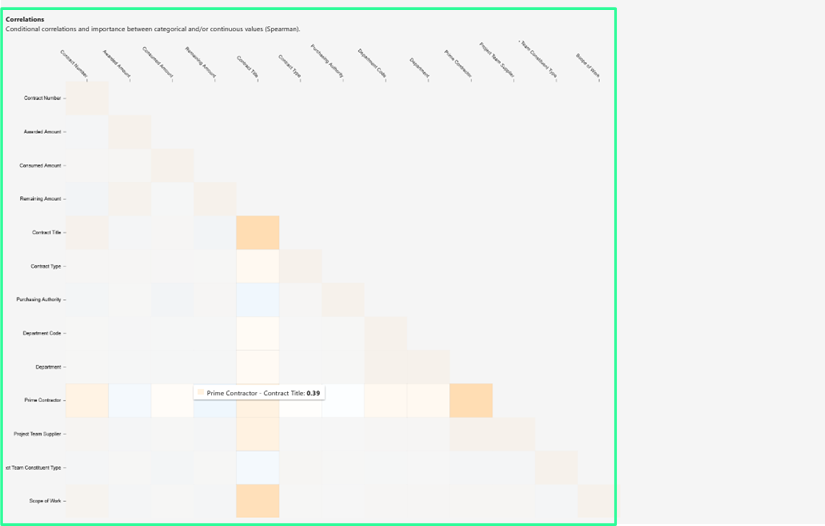 Visualizes how strongly each column is related to others
Example use case
Scenario: You’re exploring a new table and want to define initial data quality rules based on existing patterns.
Solution:
Use the Profiling tab to identify:
Columns with high NULL rates → create a "Not empty" rule
Columns with low uniqueness → consider "Categorical"
Fields with strong correlations → define a multi-column rule (e.g. Awarded Amount = Consumed + Remaining Amount)
 Notes
Notes
The Profiling tab is read-only
Use it to quickly spot columns that require rules
Learn more: Overview of existing rules, Rule prediction and how it works, Working with the Rules tab