
Table – Profiling
The Profiling screen provides a detailed overview of your table's structure and content. It helps identify potential issues and supports rule creation by showing statistics and relationships between columns.
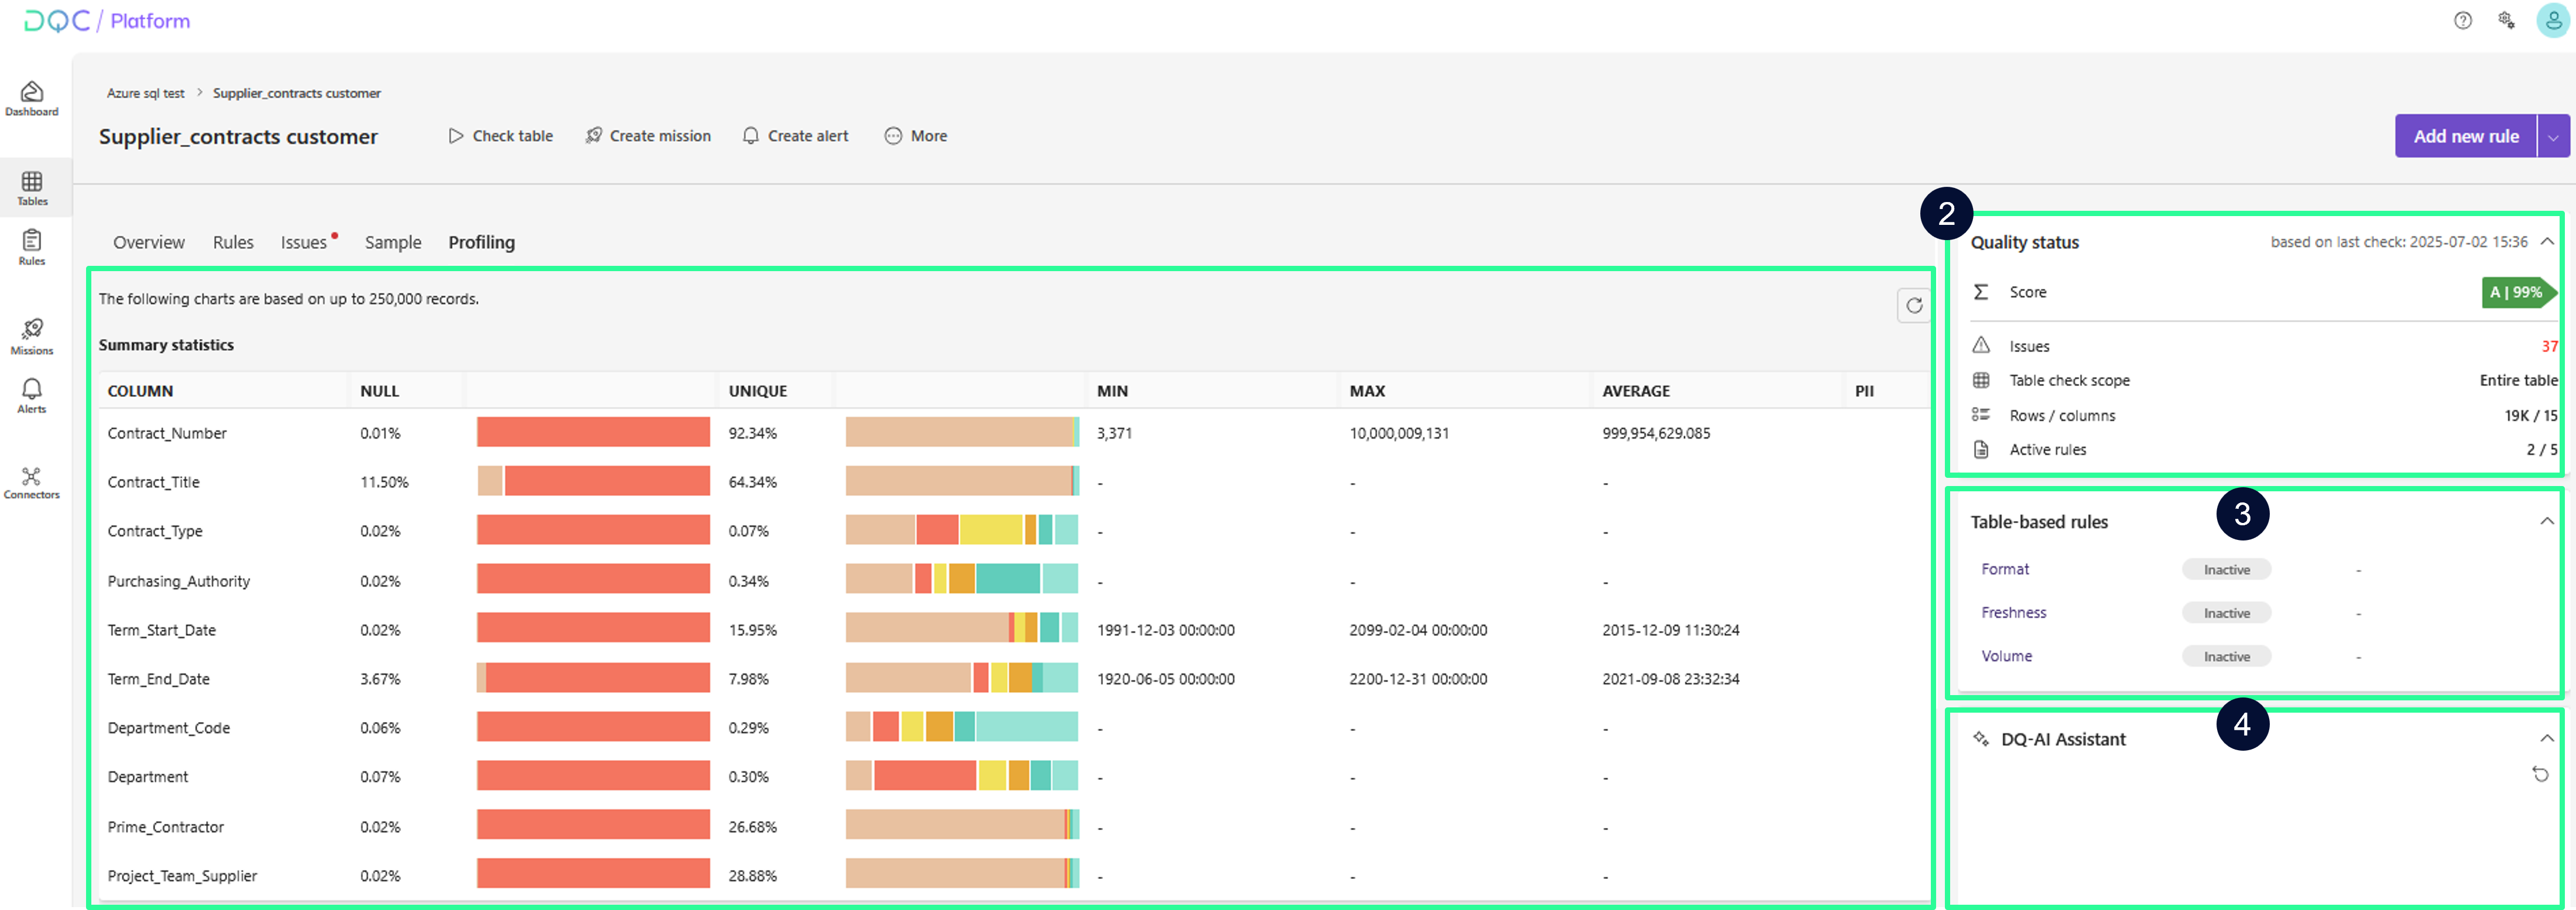
(1) Summary statistics
The summary statistics section shows an overview of each column in the table based on a sample of up to 250,000 rows. For each column, the following metrics are displayed:
NULL – Share of missing values
UNIQUE – Share of unique values
MIN/MAX/AVERAGE – Minimum, maximum, and average values (for numeric/date fields)
PII – Highlights potential Personally Identifiable Information
PII refers to data that can be used to identify an individual. Because of legal and compliance requirements, PII often requires special handling.
We scan for a broad range of PII categories using a combination of machine learning and regex-based detection. Categories are assigned probabilistically and may not always be perfectly accurate.
PII categories include:
Social Security Number / US SSN
German Passport Number
Credit Card Number
IBAN
Person Name
Email
Phone Number
IP Address
URL
(2) Quality status
Displays the overall quality score and summary for the table based on the most recent check.
Score – Percentage of quality based on all active rules
Issues – Total number of current data quality issues
Table check scope – Scope of validation (e.g., full table)
Rows / columns – Total entries and attributes checked
Active rules – Number of rules currently active
(3) Table-based rules
Shows the current status of table-level rules like:
Format – Verifies structural consistency (e.g., expected pattern)
Freshness – Checks how recently the data has been updated
Volume – Monitors row count for major changes
(4) DQ-AI Assistant
You can use the DQ-AI Assistant to:
Ask questions about your data
Generate new rule suggestions
Get help with data interpretation or insights
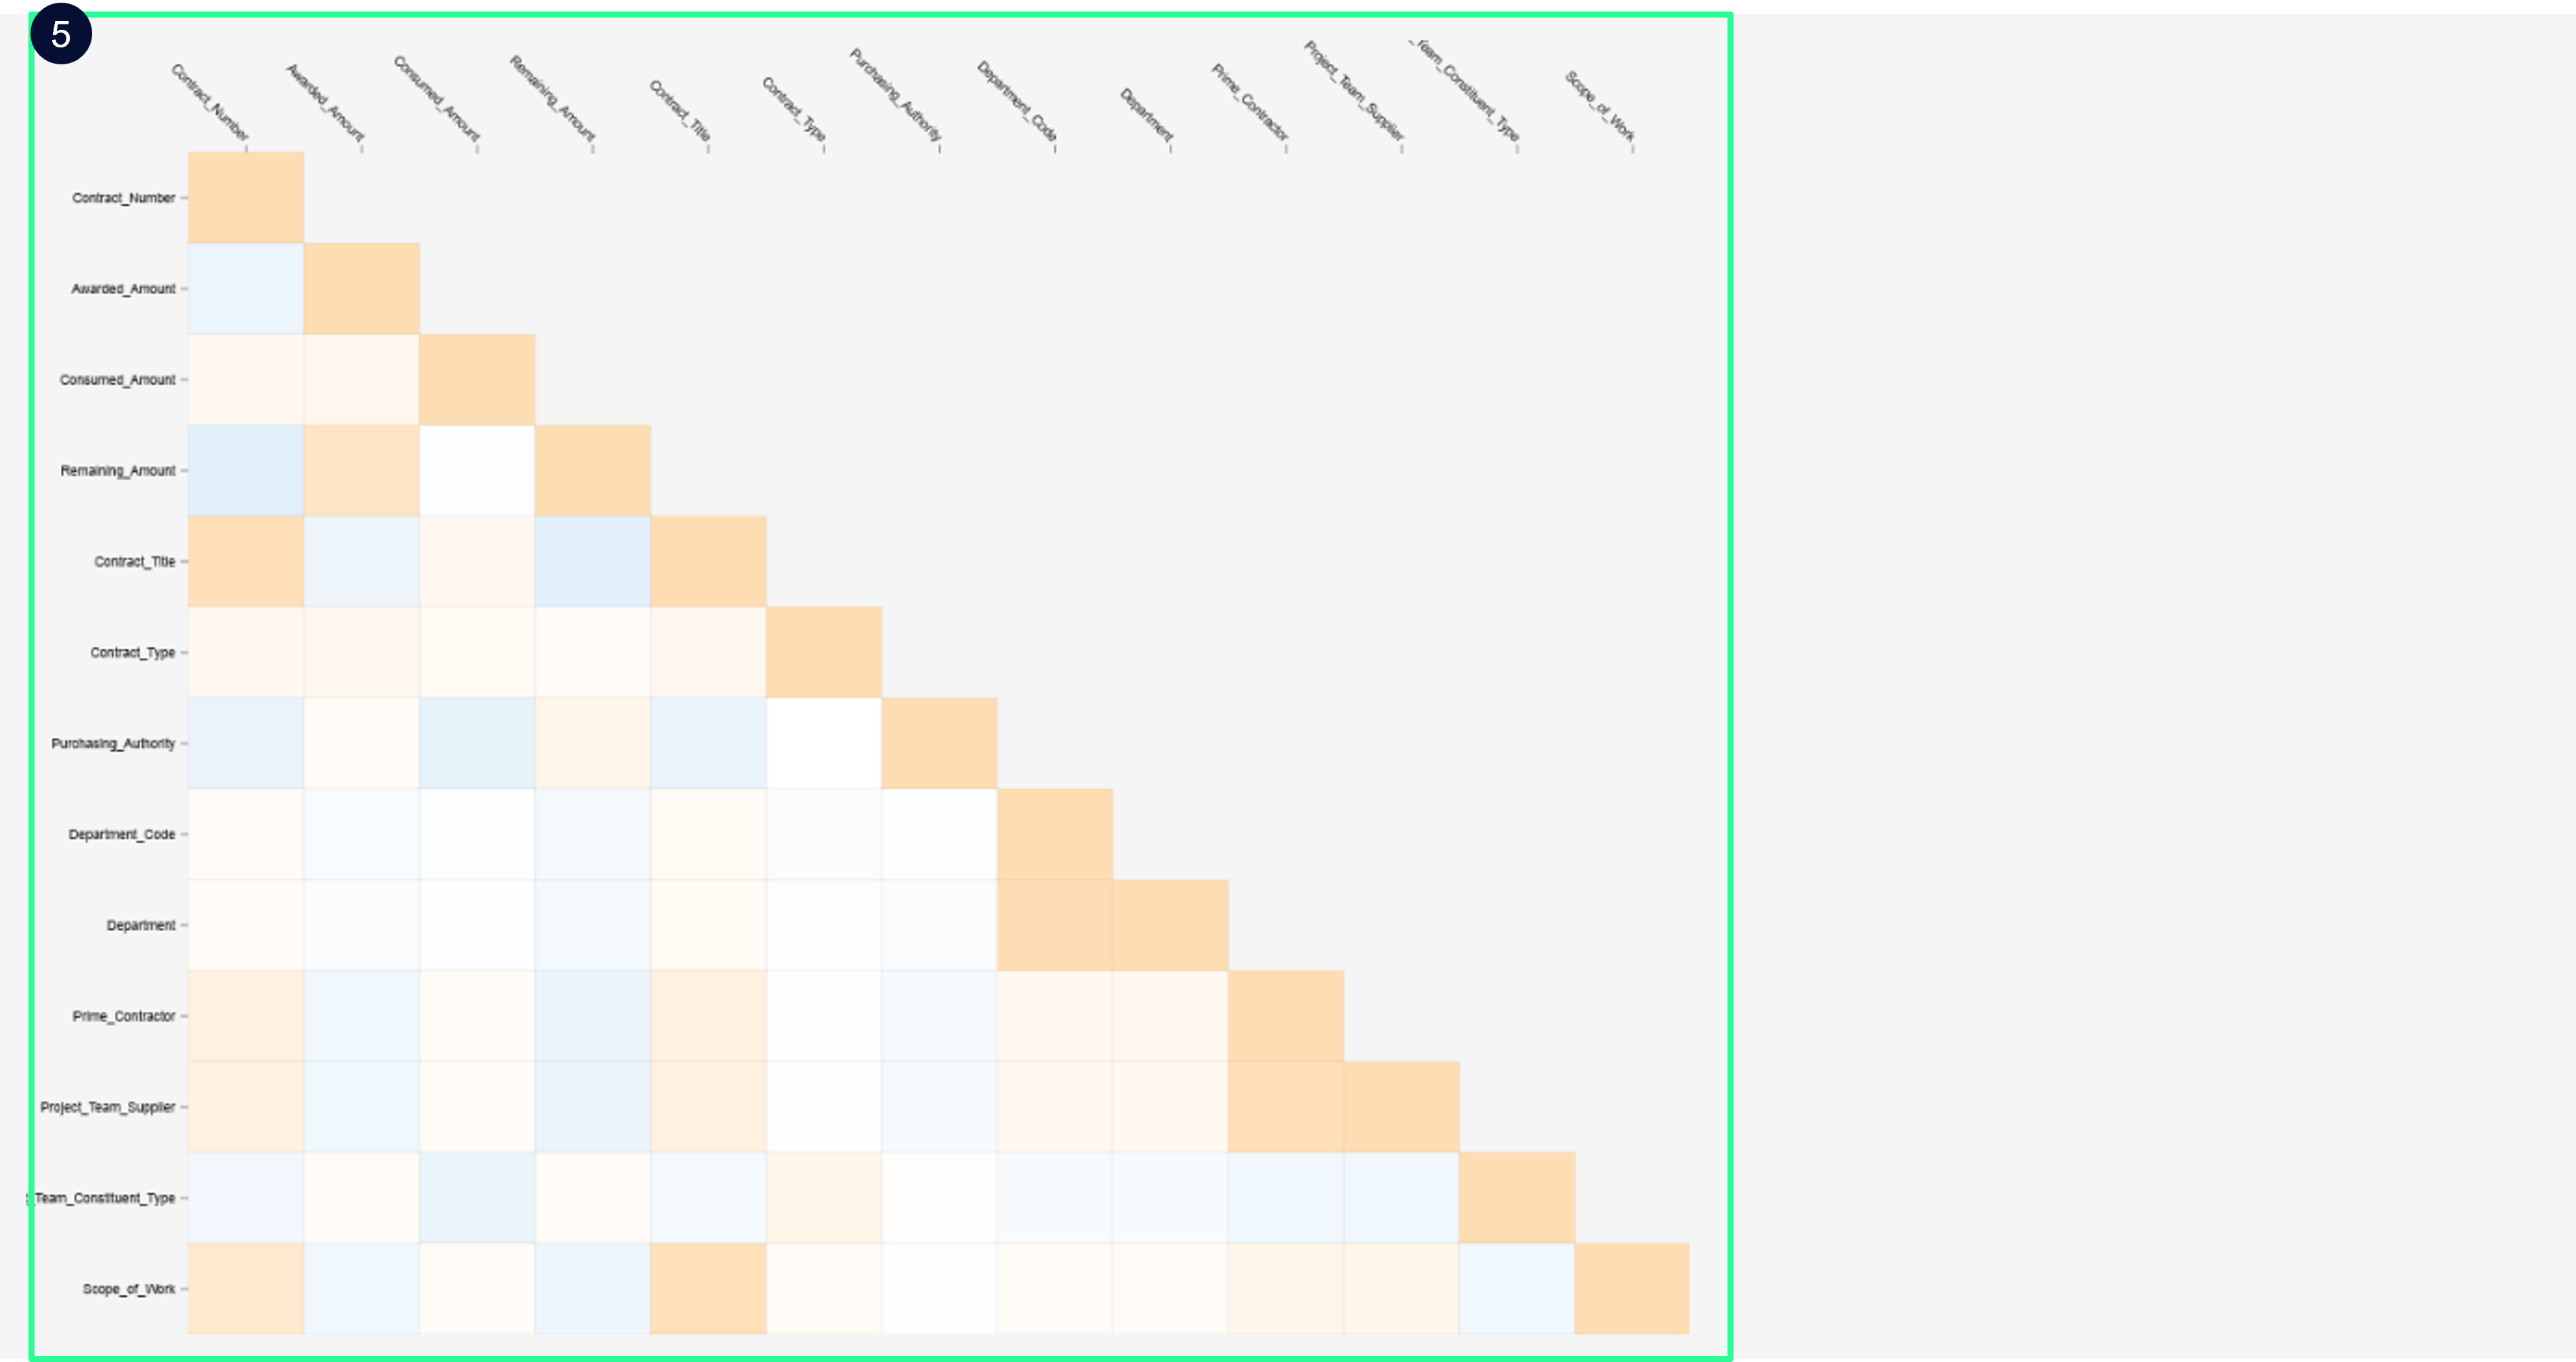
(5) Correlation matrix
The correlation matrix visualizes relationships between different columns in the dataset.
Yellow = Positive correlation
Blue = Negative correlation
Hover over any intersection to see the exact correlation value
 Notes
Notes
Profiling helps you decide where to apply the most relevant rules
Statistics are based on a maximum of 250,000 sample rows
Correlation matrix is useful for identifying redundant or dependent fields
Learn more: Table – Rules Screen, Table – Issue Screen, Table-Based Rules Overview