
Table overview screen
The Table overview screen displays all loaded tables from connected data sources. It provides key metrics on data quality and allows users to manage and explore datasets directly from one central location.
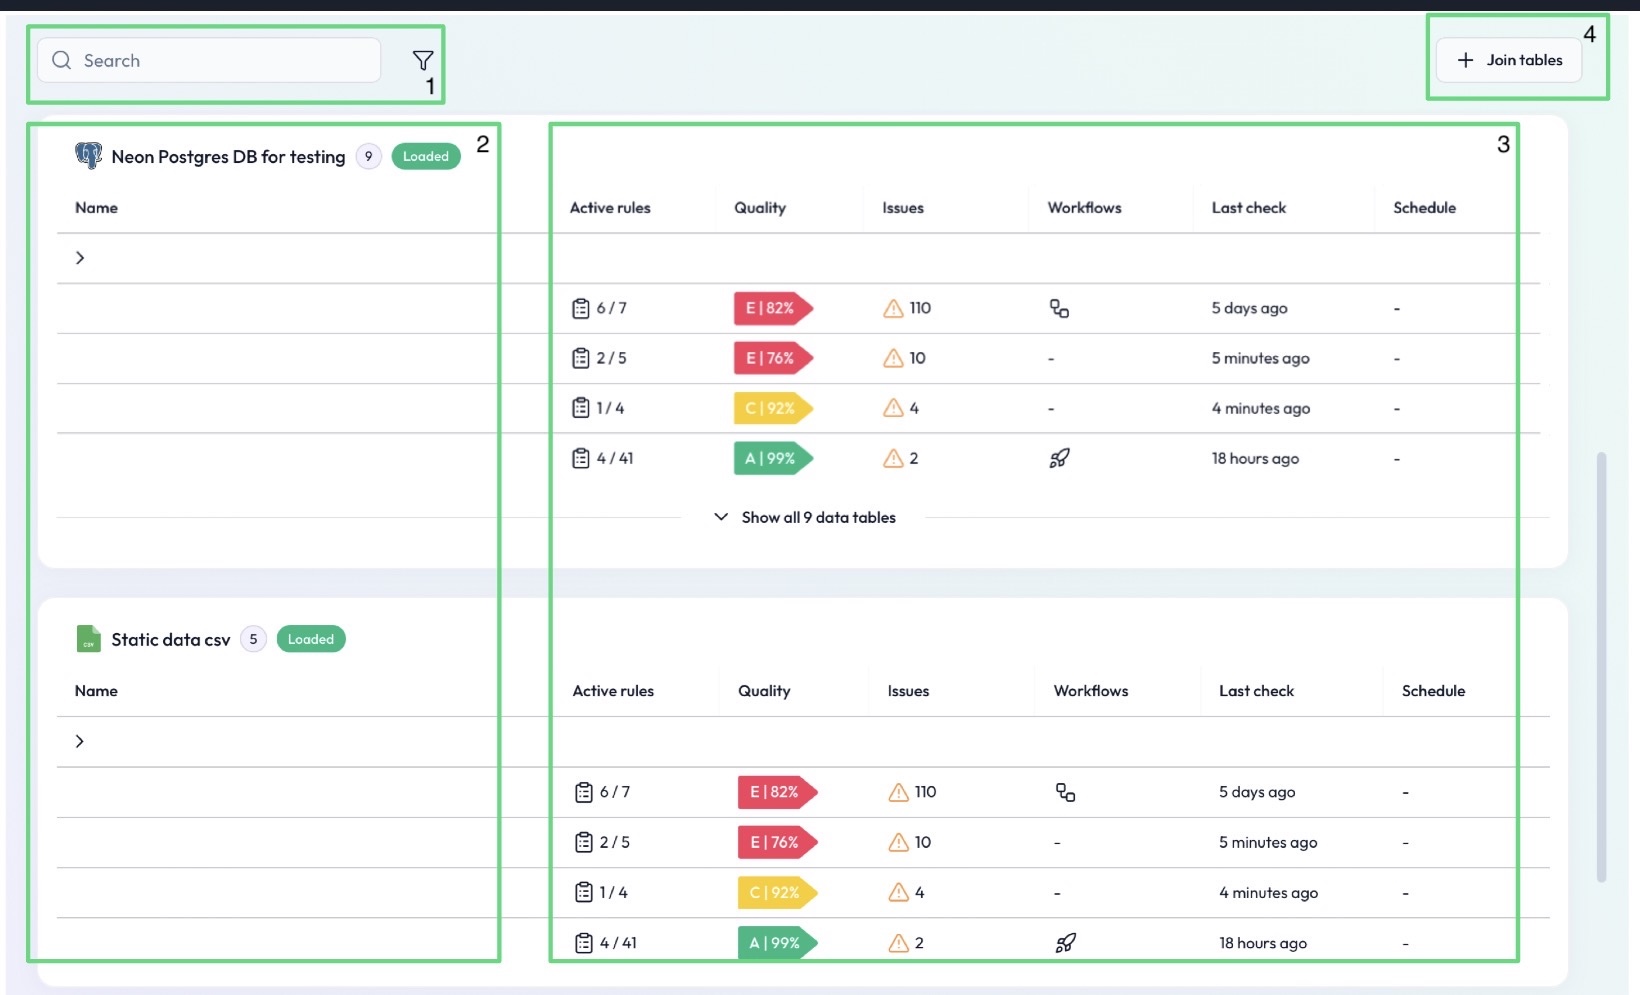
(1) Search
Use the search bar at the top to quickly find specific tables:
Search by table name
Use filters to narrow down results across multiple connectors
(2) Tables per connector
Tables are grouped by connector:
Each connected data source (e.g., Snowflake, BigQuery, Azure Blob Storage) shows its associated tables
You can expand or collapse groups for easier navigation
(3) Table info at a glance
Each table row provides an overview of its quality status:
Active Rules – Number of active vs. total rules
Quality – The table’s quality score (A–E)
Issues – Number of current issues detected
Workflows – Indicates whether workflows (e.g., alerts or missions) exist
Last Check – Date and time of the most recent table check
Schedule – Frequency of automatic data quality checks (e.g., daily)
(4) Join tables
Click Join tables to start creating a virtual table:
Combine multiple tables into one view
Used for cross-table rule creation and advanced validations
 Notes
Notes
The overview screen is the best place to monitor data health across all connected systems
Tables with missions or alerts show an icon for quick access
Learn more: Creating Rules, Virtual Tables, Missions and Alerts Overview