
Overview screen
The overview screen provides a centralized summary of key metrics, trends, and smart suggestions for each connected table in the DQC Platform.
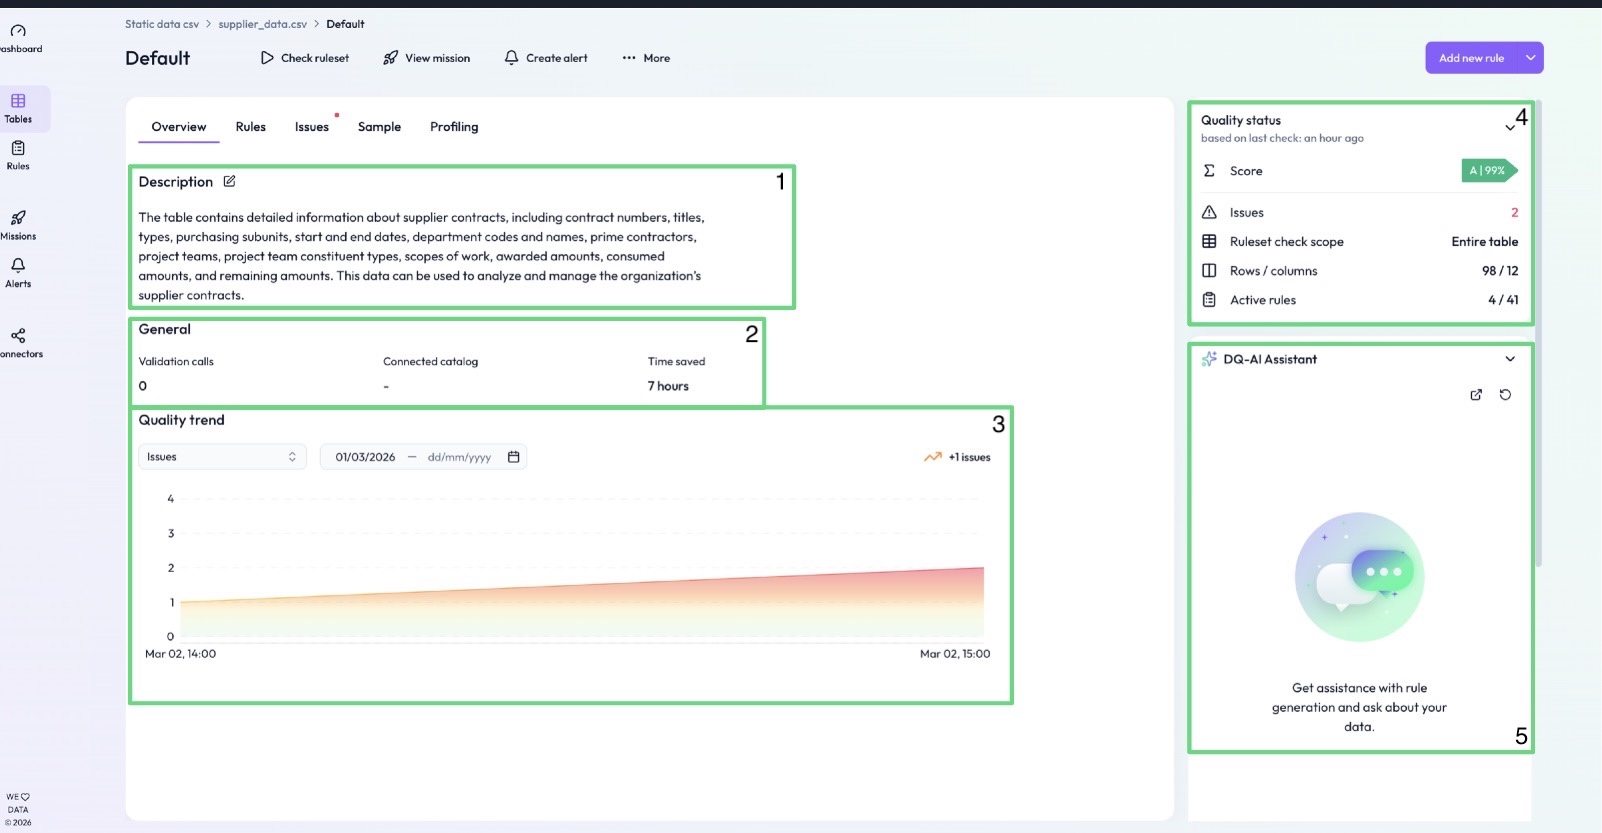
1. Table description
At the top of the overview, you can generate an automated description of the table. This automatically summarizes what the table contains—such as contract numbers, departments, amounts, etc.
You can edit the description manually by clicking the pencil icon.
2. General info
This section provides high-level table stats, including:
Validation calls – Number of real-time API validations triggered
Connected catalog – Indicates whether this table is connected to a catalog (e.g., Ataccama, Collibra)
Time saved – Estimates the time saved using automated DQC Platform features
3. Quality trend
Track how your data quality evolves over time. You can:
Switch between Issues or Quality Ratio view
Adjust the date range using the dropdown
Visualize sudden spikes, improvements, or regressions in quality
4. Quality status
Gives a compact summary of current table health:
Score – Current quality score (A–E) based on latest table check
Issues – Number of issues identified in the most recent check
Table check scope – Indicates if the entire table or a sample was checked
Rows / columns – Number of rows and columns evaluated
Active rules – Number of active rules applied to the table
5. DQ-AI Assistant
The DQ-AI Assistant is always accessible on the right side of the screen.
Type questions about the table, data quality, or desired rules
The assistant will analyze your prompt and suggest rules (e.g., "Contract_Number should be mandatory")
Click “Apply” to insert the suggestion into the rule creation panel
 Notes
Notes
The overview helps quickly assess table health and quality trends
Suggested rules can be fine-tuned or used as-is via the DQ-AI Assistant
Learn more: Creating Rules with the Assistant, Quality Score, Power BI dashboards