
Quality score
The quality score summarizes the overall state of data quality for a table by assigning a letter grade (A–E) based on the underlying quality ratio. These scores help quickly identify where data meets expectations and where improvements are needed.
What Is the quality score?
The score is a classification (A to E) derived from the quality ratio — the percentage of valid rows for all rules applied to a table.
It provides a standardized, visual assessment that is:
Easy to communicate
Useful for comparison across tables
Ideal for dashboards, alerts, and reporting
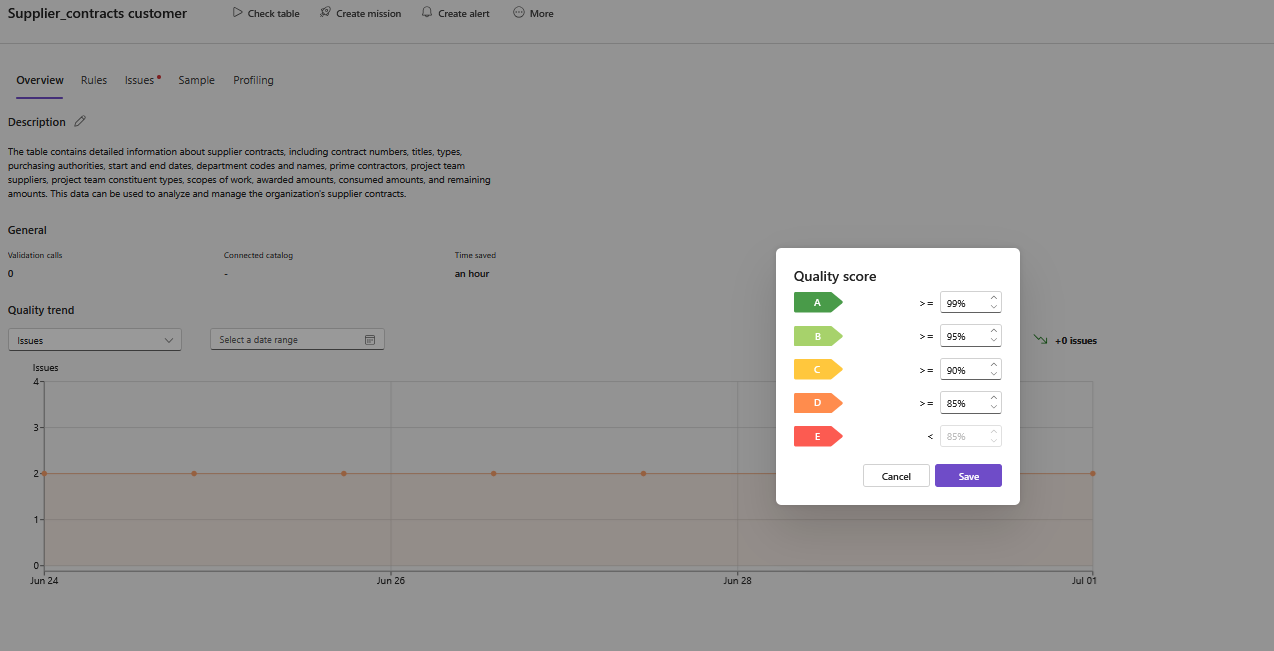
Configurable score thresholds
Different tables may require different standards. You can customize the thresholds for A–E grades per table.
To adjust thresholds:
Go to the relevant table screen
Click on the “More” menu
Select “Quality score”
 Tailor expectations based on table criticality
Example
Table A: Fraud Detection Transactions
→ Tighter thresholds (e.g., A = >99.9%) because any issue matters
Table B: CRM Contact Records
→ More tolerant thresholds (e.g., A = >95%) where some missing data (e.g. phone numbers) is acceptable
Default thresholds
Unless changed, the platform uses:
Grade | Default Quality Ratio |
|---|---|
A | > 99% valid entries |
B | > 95% |
C | > 90% |
D | > 85% |
E | ≤ 85% |
These defaults can be overridden per table via the settings.
Where scores are used
Dashboard overview cards
Ruleset views
Missions and alerts
BI dashboards
 Notes
Notes
The score is calculated automatically after each data check
Thresholds can be updated at any time — retroactively affecting badge displays
Learn more: Quality Ratio, Alert Setup