
v2.26
New features 
Table overview tab: We've made table information more accessible by adding an "Overview" tab as the default view, offering a quick snapshot of your table's data quality. Here, you can describe the table manually or use AI assistance as shown below. A quality trend chart at the bottom displays historical data quality, allowing you to toggle between "Issues" and "Quality Ratio" and adjust the timeframe as needed.
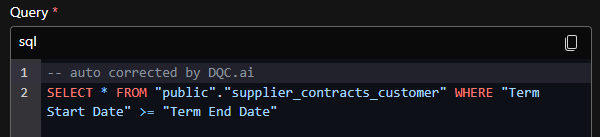
Improvement for the text-to-rule feature: We enhanced how numeric multi-column rules are generated by the DQ-AI Assistant, improving column and condition detection. We also added a validation loop to ensure every suggested rule can be successfully created. Here you can see how an SQL syntax was auto-corrected:
Data quality ratio:This ratio reflects how closely the data aligns with its ideal state. For each rule, it compares the number of valid rows to the total rows being evaluated, creating a quality ratio. By factoring in the overall row count, the quality ratio provides a more balanced perspective than a raw issue count—especially when comparing large and small tables.Calculation of the quality ratio on different levels:
Rule level: (Total rows for this rule - issue rows) / Total rows for this ruleKeep in mind that "Total rows for this rule" is calculated by the number of rows in the table minus potential rule filters and excluded Null values.
Column level: Mean of all rule quality ratiosRuleset level: Mean of all column quality ratiosAggregated ruleset level quality ratios e.g. used for mission and alert overview and the dashboard:
Mean of all ruleset quality ratios to which the user has accessExample: If a table has 1000 rows and 50 issues from empty entries the quality ratio is 95% ((1000 - 50) / 1000). If 250 filled rows are added to the table the quality ratio improves by 1 percentage point to 96% ((1250 - 50) / 1250).The quality ratio is also added to the quality trend charts, It is possible to switch between issues and quality ratio:
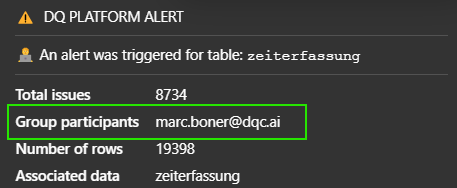
Participant information added to notifications: We added participant details to mission and alert notifications, giving users a clear view of who is involved in improving data quality.
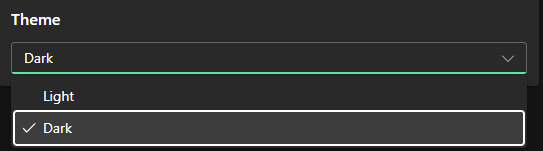
Dark mode:You can now switch to a dark theme under Settings > Profile > Theme. The screenshots and GIFs in these release notes are taken from the dark theme.
Bug fixes and visual improvements 
Fixed a bug on the Azure SQL connector that made a custom SQL rule fail
Fixed a bug where the profiling was failing for some binary columns
Smaller bug fixes and wording changes
Breaking changes:  ️
️
-